If you invest in Los Angeles apartments, Ventura County can look familiar at first glance: high housing costs, tight supply, and a renter base shaped by affordability pressure. But once you look closer, the county tells a more nuanced story. You are not just buying rent growth here. You are buying into a market where submarket selection, older building stock, and property-specific compliance can shape returns just as much as headline rents. Let’s dive in.
Why Ventura County Gets Investor Attention
Ventura County remains a sizable and expensive Southern California housing market. Census QuickFacts puts the county at 830,851 residents in July 2025, with a 64.6% owner-occupied housing rate, median household income of $109,797, and median owner value of $822,700. For LA investors, that combination signals a market where homeownership is costly and renting remains an important part of the housing picture.
Rent levels also support investor interest. Recent market trackers place average apartment rent around $2,757 to $2,763 per month, while Census reports median gross rent at $2,317. That gap matters because these sources measure different parts of the rental market, so it is smarter to think in ranges rather than force one countywide number.
Demand Is Holding Up
Renter demand in Ventura County is closely tied to affordability. County planning documents note that renter households carry a large share of housing-related challenges, while SCAG points to rising home prices and land-use constraints that push development into more compact patterns. In plain terms, many households who might want to buy still remain renters.
The local job base adds another layer of support. SCAG says healthcare and local government were the main job creators in 2025, with logistics also contributing through Port Hueneme and the Amazon facility in Oxnard. For investors, that helps reinforce the case for steady apartment demand across multiple parts of the county.
Supply Is Improving, But Still Selective
New apartment deliveries have helped, but they have not erased the supply story. SCAG reports 3,200 apartment completions since 2020, including 1,373 deliveries in 2024. Vacancy rose to 5% in early 2025 and then dropped to 3.6% in the first half of 2025 as demand absorbed new supply.
CBRE’s Q1 2026 snapshot shows a similar picture of resilience. It reported 96.1% occupancy, 607 units of positive absorption, 585 completions, and average rent of $2,757. Rent was up 1.4% from Q4 2025, though still 0.6% below the prior year, which suggests a market that remains healthy without feeling overheated.
What The Typical Asset Looks Like
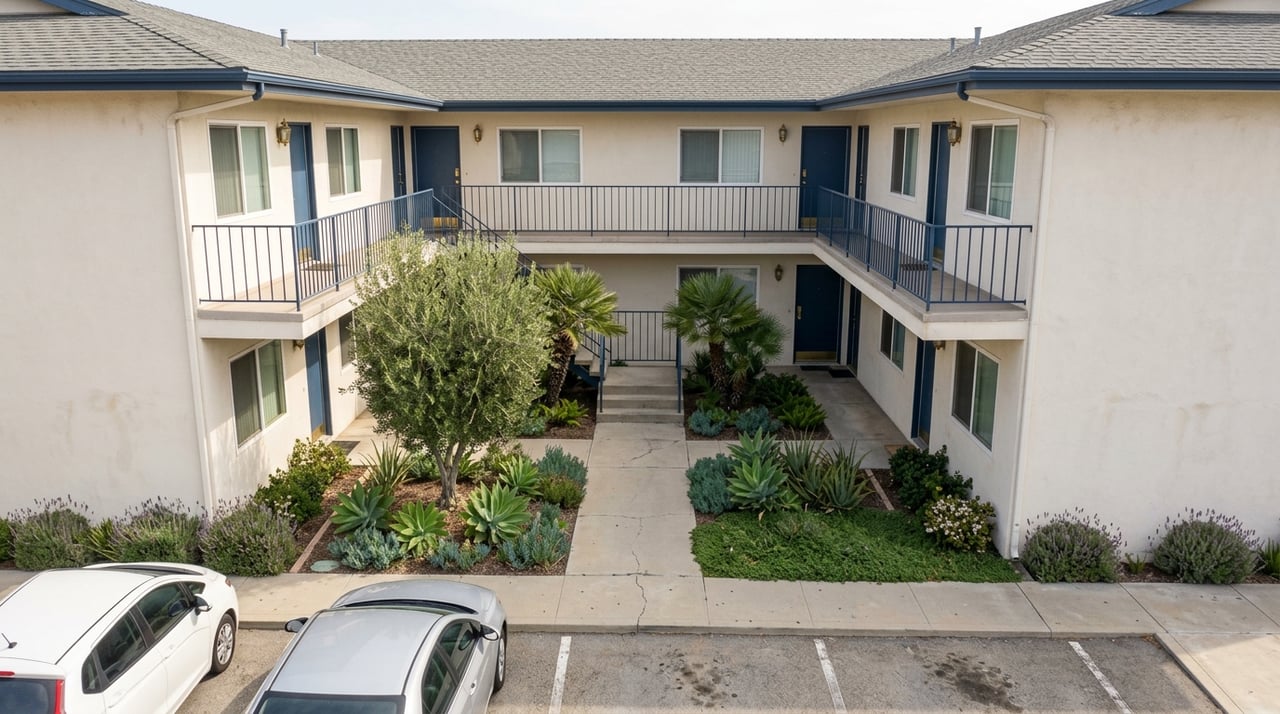
For many LA buyers, Ventura County inventory will feel familiar in one important way: much of the rental stock is older. The countywide Consolidated Plan says 59% of all housing units were built before 1980. Among renter-occupied units, 42.5% were built from 1950 to 1979 and 14.4% were built before 1950.
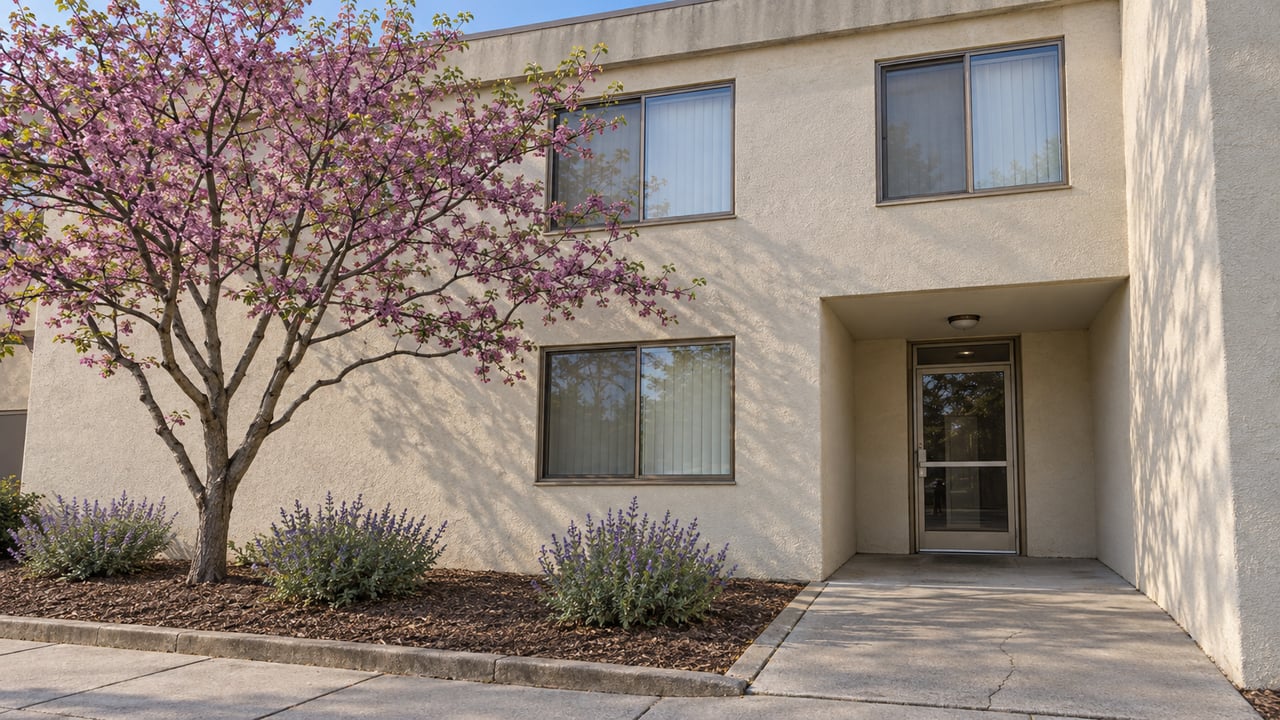
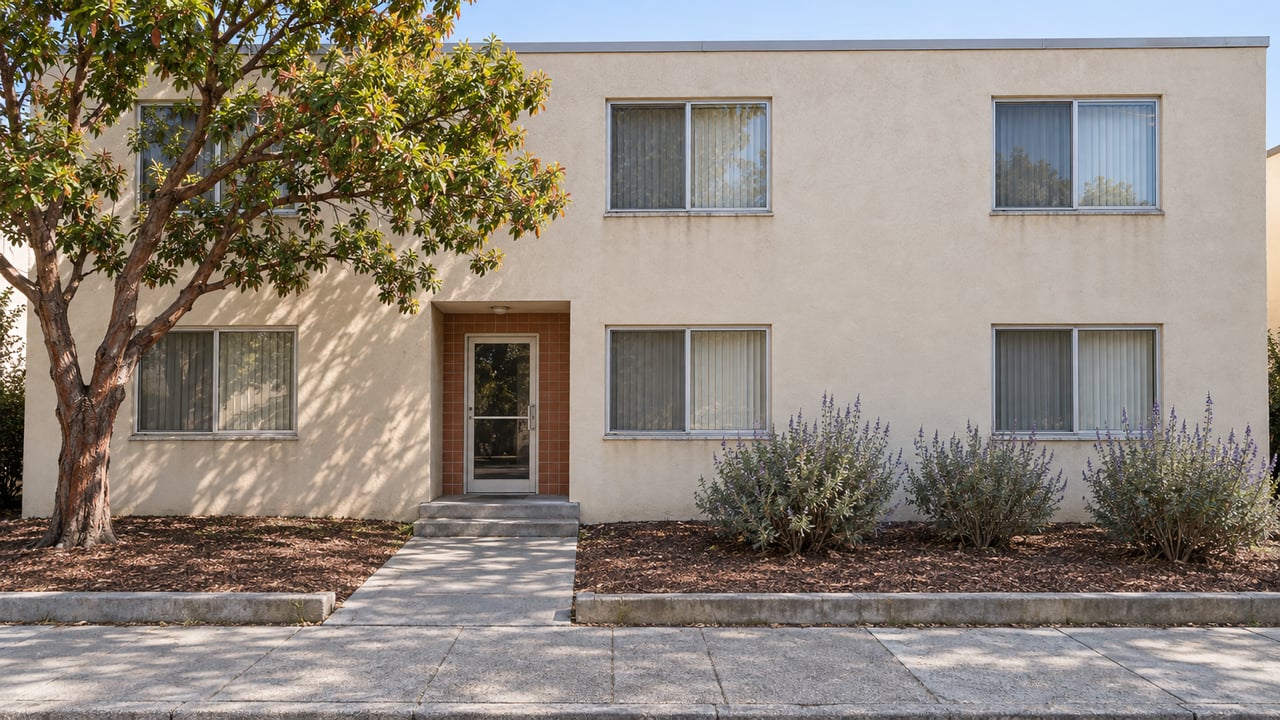
That age profile matters because it shifts the investment conversation. In Ventura County, many acquisitions involve vintage, low-rise assets where deferred maintenance, renovation planning, and operational strategy can drive performance. This is often less about chasing brand-new product and more about understanding what an older building needs over the next five to ten years.
The county’s broader housing mix reinforces that point. Detached housing still dominates overall stock, while apartments make up a smaller slice. The Consolidated Plan says 64% of housing units are single-detached, 12% are single-attached, 5% are in 2 to 4 unit properties, 9% are in 5 to 19 unit properties, and 7% are in 20+ unit properties.
Rent By Unit Type
CBRE’s Q1 2026 data gives a helpful snapshot of pricing by unit mix across the county’s tracked inventory of 42,163 units:
- Studio: $2,225
- 1 bedroom: $2,455
- 2 bedroom: $2,906
- 3 bedroom: $3,478
These figures can help you test income assumptions when you evaluate a deal. They are also a reminder that unit mix matters in Ventura County, especially if you are comparing a smaller garden-style asset to a larger apartment community.
Read The County In Two Lanes
A practical way to view Ventura County is through two broad lanes: the Ventura and Oxnard corridor, and the Camarillo, Thousand Oaks, Simi Valley, and Moorpark corridor. This is only an analytical shorthand, but it is useful for underwriting because renter concentration, occupancy, and rent levels vary across these areas.
The Ventura and Oxnard side tends to offer a larger renter base. RentCafe shows renter-occupied shares of 46% in Oxnard and 41% in Ventura. By comparison, renter shares are 35% in Camarillo, 29% in Thousand Oaks, and 27% in Simi Valley.
For an LA investor, that can point to different strategies. A larger renter base may support more transaction activity and a broader tenant pool, while more owner-leaning areas may appeal if you prioritize stability and lower turnover assumptions. The key is to match the submarket to your goals rather than treat the county as one uniform apartment market.
City Rent And Occupancy Snapshot
Recent city-level data shows how varied the county can be:
| City | Average Rent | Occupancy |
|---|---|---|
| Oxnard | $2,698 | 95.6% |
| Ventura | $2,805 | 94.0% |
| Camarillo | $2,848 | 97.4% |
| Thousand Oaks | $2,898 | 96.2% |
| Simi Valley | $2,637 | 96.5% |
This snapshot highlights an important point. The highest average rent is not automatically tied to the largest renter base, and the strongest occupancy is not always in the most obvious coastal location. That is why Ventura County rewards local, submarket-level analysis.
Where New Supply Is Landing
New supply is not spread evenly across the county. SCAG says Oxnard and Camarillo led all 10 Ventura County cities in new housing starts through 2024. In 2025, Oxnard, Camarillo, and Santa Paula permitted nearly all apartment units in the county, totaling 729 units through July.
This concentration matters for investors comparing older assets to newer competition. If you own or acquire in a city with more active development, your renovation and leasing strategy may need to account for that pipeline. In areas with less incoming supply, older assets may benefit more from scarcity, assuming the building is maintained and competitively positioned.
Sales Activity And Cap Rate Context
Ventura County is still seeing meaningful multifamily sales, even if activity can be uneven from quarter to quarter. CBRE’s Q1 2026 report logged $184.4 million in multifamily sales volume. Major trades included the 235-unit Tempo Riverpark sale in Oxnard for $105 million and the 165-unit Alara Camarillo sale for $69.5 million.
For pricing context, NAI Capital’s Q1 2025 report showed a 4.4% countywide cap rate, with the south submarket at 5.4% and the north submarket at 3.5%. Those figures should be handled carefully because market definitions differ by provider, but they still show that pricing and yield can vary significantly depending on location and asset profile.
The Big Underwriting Issue: Property Specific Risk
Ventura County underwriting should stay disciplined because this market has several moving parts at once. You are dealing with a supply-limited region, but also one where many apartment buildings are older and may need near-term capital work. That can affect both cash flow and timing on value-add plans.
It is also important to stay property-specific on rent growth assumptions. Market averages are useful for orientation, but they do not replace a close review of actual unit condition, competing inventory, and city-level supply. In a county like this, a strong deal on paper can weaken quickly if renovation costs or operational limits are underestimated.
California Rules Matter Here
California’s Tenant Protection Act, AB 1482, applies to most residential landlords. The law caps annual rent increases at 5% plus CPI, or 10% total, whichever is lower, and it requires just cause for most terminations after the applicable occupancy period. Some newer construction and certain single-family or condo situations may be exempt when the required notice is given.
The California Attorney General also notes that cities and counties may impose additional limits or relocation requirements. For Ventura County investors, that means you should evaluate each property on its own facts and in its specific city context. This is especially important when you are looking at older low-rise assets where compliance, renovation plans, and tenant strategy intersect.
What LA Investors Should Watch Most
If you are comparing Ventura County to Los Angeles opportunities, a few themes stand out:
- Demand remains durable because high home prices keep many households in the rental pool.
- Supply is improving slowly, not flooding the market.
- Older inventory creates opportunity, but also raises capital planning risk.
- Submarket choice matters because renter concentration, occupancy, and new supply differ city by city.
- Compliance is part of underwriting and should not be treated as an afterthought.
Taken together, Ventura County can fit several investor profiles. It may appeal to exchange buyers seeking a different risk mix, long-time owners repositioning capital, or private buyers looking for low-rise multifamily with value-add potential. The best opportunities usually come from matching the right asset to the right strategy, not from chasing countywide averages.
If you are weighing a sale, acquisition, or 1031 exchange in Ventura County, working with an advisor who understands low-rise multifamily, local submarkets, and investor goals can make the numbers clearer. To discuss strategy, valuations, or apartment opportunities across LA and Ventura County, connect with Evans Investment Group.
FAQs
What makes Ventura County attractive for LA apartment investors?
- Ventura County combines high rents, limited long-term supply, and renter demand supported by housing affordability pressure and local job growth.
How much is apartment rent in Ventura County?
- Recent sources place average apartment rent around $2,757 to $2,763 per month countywide, though rent varies by source, property type, and city.
Which Ventura County cities have the highest apartment rents?
- Recent city data shows average rents of about $2,898 in Thousand Oaks, $2,848 in Camarillo, $2,805 in Ventura, $2,698 in Oxnard, and $2,637 in Simi Valley.
Are Ventura County apartment buildings mostly older assets?
- Yes. County planning data shows a large share of renter-occupied units were built before 1980, which makes capital planning and renovation strategy especially important.
How tight is the Ventura County apartment market?
- Recent reports show occupancy around 96.1% countywide and vacancy between 3.6% and 4.0%, depending on source and timing.
What should investors know about Ventura County apartment supply?
- New supply has increased since 2020, but development remains selective and is concentrated in places like Oxnard, Camarillo, and Santa Paula.
Does California rent control affect Ventura County apartment investing?
- Many properties are affected by California’s Tenant Protection Act, AB 1482, so investors should review each property’s rent cap and just-cause rules carefully.
How should LA investors analyze Ventura County submarkets?
- A useful approach is to compare the Ventura and Oxnard corridor with the Camarillo, Thousand Oaks, Simi Valley, and Moorpark corridor, while reviewing renter share, occupancy, rent, and supply by city.